07. Implementing RANSAC for Lines
Implementing RANSAC for Lines
Implementing RANSAC for Lines
ND313 C1 L2 A12 Implementing RANSAC For Lines [LB]
Here you will complete a quiz that has you implement RANSAC for fitting a line in 2D point data with outliers. The quiz is located in
src/quiz/ransac/ransac2d.cpp
, and the function to fill out is
Ransac
, which takes in arguments for a point cloud, max iterations to run, and distance tolerance. The point cloud is actually
pcl::PointXYZ
but the z component will be set to zero to make things easy to visualize in 2D space.
The data shown below was generated by creating a line with points slightly scattered, and then outliers were added by randomly placing points in the scene. You want to be able to identify which points belong to the line that was originally generated and which points are outliers. To do this you will randomly sample two points from the cloud and fit a line between the points. A helpful line equation for this problem can be seen below.
Point Data
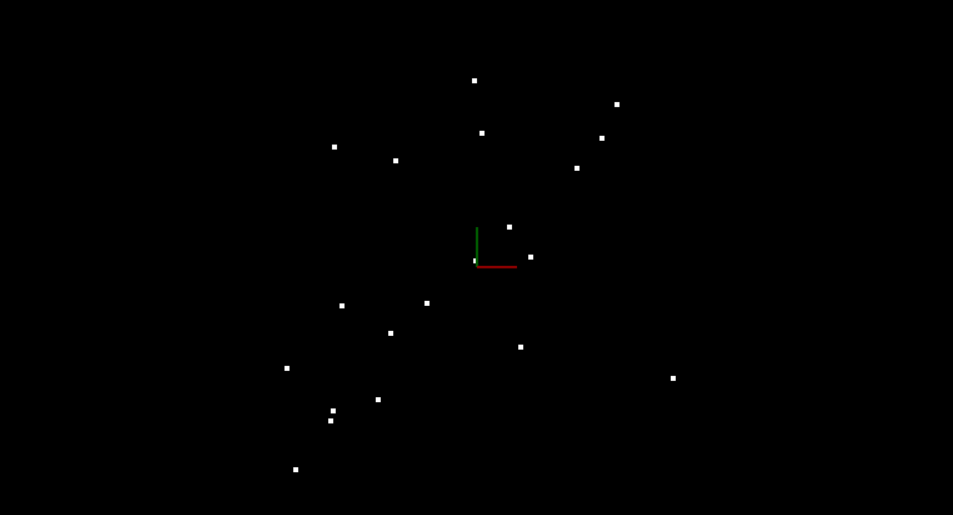
Simple 2D Point Cloud Data
RANSAC Implementation
Equation of a Line Through Two Points in 2D
For variables x and y and coefficients A , B , and C , the general equation of a line is:
Given two points: point1 (x1, y1) and point2 (x2, y2) , the line through point1 and point2 has the specific form:
Using Distance to Find the Best Line
After fitting the line you can then iterate through all the points and determine if they are inliers by measuring how far away each point is from the line. You can do this for each iteration keeping track of which fitted line had the highest number of inliers. The line with the most inliers will be the best model. The equation for calculating distance between a point and line is shown below. For further details see, https://brilliant.org/wiki/dot-product-distance-between-point-and-a-line/ .
- Line formula Ax + By + C = 0
- Point (x,y)
- Distance d = |Ax+By+C|/sqrt(A^2+B^2)
Below are the results of doing RANSAC to fit a line from the data above. Inliers are green while outliers are red. The function had a max iteration count of 50 and a distance tolerance of 0.5. The max iteration size to run depends on the ratio of inliers to the total number of points. The more inliers our data contains the higher the probability of selecting inliers to fit the line to, and the fewer iterations you need to get a high probability of selecting a good model.
Point Data Segmented
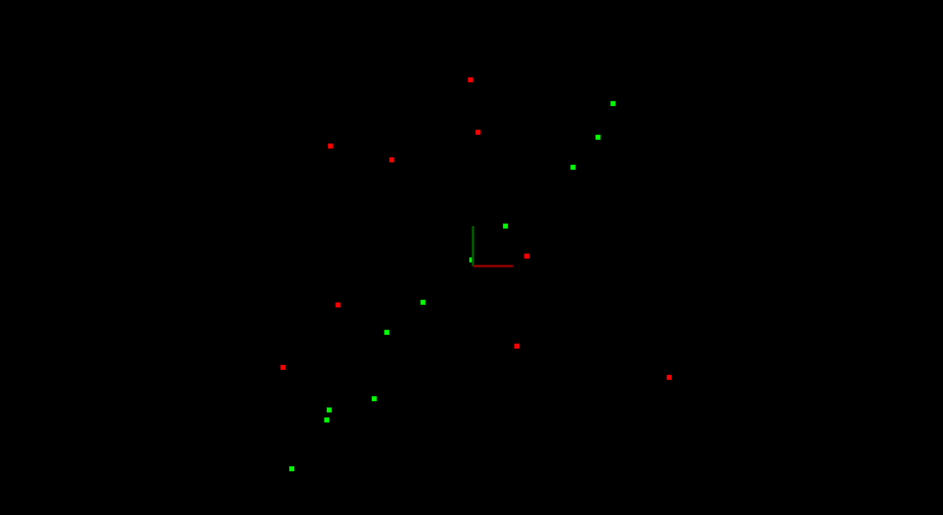
Fitted Line using RANSAC
Instructions
Instructions
-
Go to
src/quiz/ransac/ransac2d.cpp -
Complete the function
Ransacfollowing the instructions above
Compile/Run
-
Go to
src/quiz/ransac -
mkdir build -
cd build -
cmake .. -
make -
./quizRansac
Workspace
This section contains either a workspace (it can be a Jupyter Notebook workspace or an online code editor work space, etc.) and it cannot be automatically downloaded to be generated here. Please access the classroom with your account and manually download the workspace to your local machine. Note that for some courses, Udacity upload the workspace files onto https://github.com/udacity , so you may be able to download them there.
Workspace Information:
- Default file path:
- Workspace type: react
- Opened files (when workspace is loaded): n/a
Solution
Solution
ND313 C1 L2 A17 Implementing RANSAC For Lines Solution [Too Long]